What is a convergence line, and why can it focus thunderstorms along the Valencian coast?
When low-level winds come together, storms can repeatedly form along a narrow strip. Spain’s Valencian coast offers a good place to see how this works.
On a summer afternoon in Sinaloa, towering clouds may be visible over the mountains while the coastal plain is still sunny. A downpour can reach the lowlands hours later. That difference in timing is one of the best ways to see the Mexican monsoon at work.
Schematic of moisture transport and upslope flow in northwestern Mexico.
The North American monsoon is a seasonal shift in atmospheric circulation that brings a rainy season to northwestern Mexico. As the continent heats up and wind patterns change, low-level winds carry more moisture inland from the Gulf of California and the eastern Pacific. Over a series of days, thunderstorms become easier to sustain.
Moisture arrives in pulses. Two equally hot afternoons can have quite different outcomes. On one, a deep layer of moist air supports growing clouds. On the other, dry air limits their vertical development.
In the Sinaloa highlands, daytime heating encourages air to flow upslope. If that air is sufficiently moist and unstable, clouds build upward. Some storms merge and move toward the foothills and coastal plain in the evening or at night. Others rain themselves out over the mountains.
In Sonora, both the supply of moisture from the gulf and the position of the mountains in the east matter. In Chihuahua, the Sierra Madre Occidental occupies much of the western part of the state. Heavy rain there can coincide with a dry afternoon in Chihuahua City. A statewide rainfall figure would hide that difference.
Pick a stretch of high ground east of Culiacán. On satellite imagery, find the first clouds to grow tall, then follow the sequence over several hours. Does one storm travel toward the plain, or do fresh storms form progressively farther downslope? Either process can make a band of rain appear to advance toward the coast.
Centre the map on Sinaloa and find the highest forecast totals. Compare their position with the mountains east of Culiacán. The selected accumulation period tells you where rain is expected to add up. Use a satellite sequence to establish when a storm actually formed.
Open the Meteorix map ↗Yes. Moisture transport and conditions for rising air vary over the summer, producing active spells and breaks.
For official forecasts and warnings, consult your national weather service.
When low-level winds come together, storms can repeatedly form along a narrow strip. Spain’s Valencian coast offers a good place to see how this works.
Parts of Mexico and Central America experience a midsummer dip in rainfall known as the canícula. Its timing and strength depend on location and year.

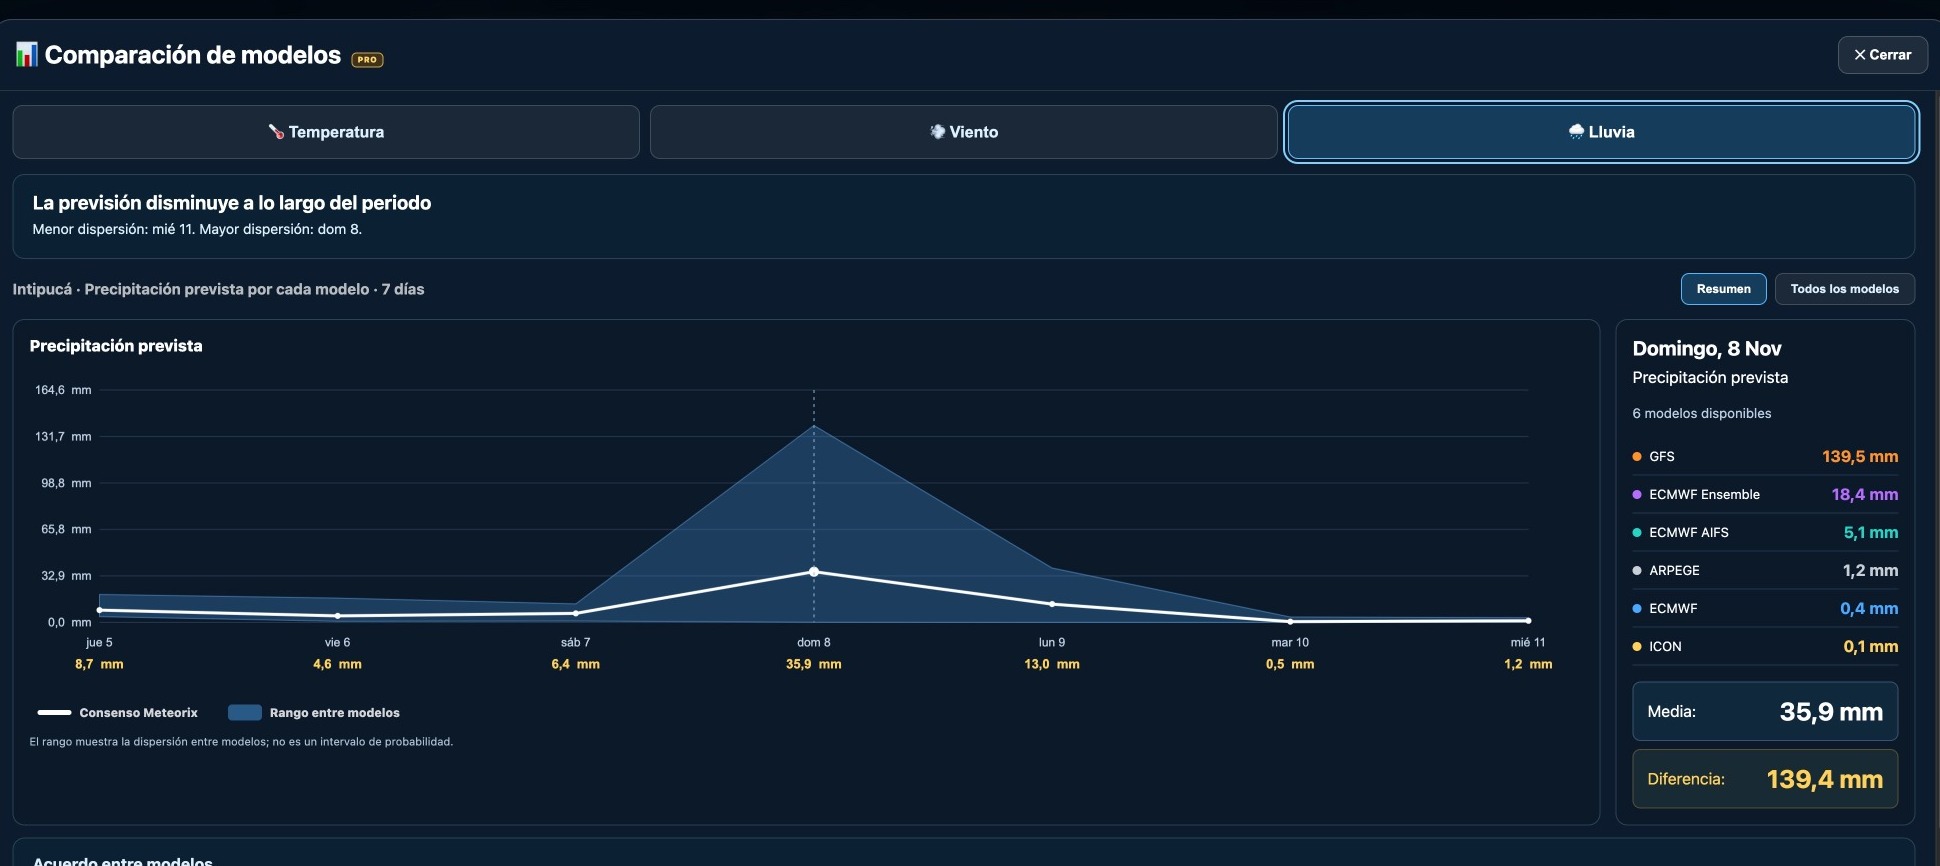
GFS forecast 139.5 mm of rain for Intipucá while several other models predicted almost none. A real Meteorix example of forecast uncertainty.
The axis of a tropical wave can cross an island in the morning and the downpours arrive hours later. To understand the timing, follow both the wind and the clouds.
Yesterday you could see a cluster of thunderstorms on satellite imagery. Today the same cluster has a label, 92L. What changed? The code tells you how forecasters are tracking the disturbance. Its intensity is a separate question.
A wind circulation can stretch across several countries between the Caribbean and the Pacific. To see which places bear the brunt of the rain, look for the river basins that one rainband after another passes over.
When a low-pressure system deepens unusually quickly, meteorologists call it explosive cyclogenesis. Learn what they measure, why latitude matters and how to track it on a pressure map.
Cloud height and shape can help you interpret a changing sky. Learn to recognise the main cloud layers and read the Meteorix cloud cover map.
Some cut-off lows pass almost unnoticed. Others help produce extraordinary rainfall. The difference depends partly on what happens below them.