What is a convergence line, and why can it focus thunderstorms along the Valencian coast?
When low-level winds come together, storms can repeatedly form along a narrow strip. Spain’s Valencian coast offers a good place to see how this works.
When a weather bulletin says that “a tropical wave is approaching the Antilles”, it describes a disturbance travelling through the atmosphere. On a weather chart the wave usually appears as a long line. It’s tempting to use that line to time the first drops of rain. But what does the line actually mark, and where are the thunderstorms forming?
Meteorix illustration of the weather pattern.
Across the tropical Atlantic, the prevailing trade winds blow broadly from the east. A tropical wave is a disturbance that generally travels west within that flow. As it passes, the winds change direction and an elongated area of relatively low pressure, called a trough, can often be identified. The line on the map marks the wave axis. Many Atlantic waves originate over Africa and reach the ocean via its west coast.
A wave can keep moving after a cluster of thunderstorms dies out. What travels is the disturbance in the wind and pressure fields. Individual clouds form, grow and dissipate as the moisture available to them and the conditions for rising air change.
Imagine two neighbouring islands. Over the first, the wave encounters a pocket of moist air and thunderstorms build. Over the second, drier air moves in and cloud growth stalls. Hours later, fresh downpours may develop out at sea. On a weather chart, the same wave axis has crossed both islands. Their rain gauges can tell very different stories.
An infrared satellite loop shows that evolution more clearly than a single image. Very cold cloud tops can help you locate high clouds and follow growing thunderstorm cells. To estimate how much rain reached the ground beneath them, compare the imagery with satellite rainfall estimates, local radar where available, or a rain gauge.
Some tropical cyclones begin as tropical waves. For a depression to develop, thunderstorms must become organised and a closed circulation must form near the surface. Warm water, moist air and weak vertical wind shear favour the process. Wind shear describes how the wind changes with height. Strong shear can carry thunderstorms away from a developing centre.
In Advanced Observation, play several infrared frames over the Antilles. Watch for cells that fade and for fresh ones developing elsewhere. Then select satellite rainfall and compare the accumulation with the paths of those cells. This lets you follow the wave’s overall movement while seeing how individual storms evolve along the way.
Open the Meteorix map ↗Thunderstorms can develop some distance from the axis. Their position depends on available moisture and how the storms organise.
For official forecasts and warnings, consult your national weather service.
When low-level winds come together, storms can repeatedly form along a narrow strip. Spain’s Valencian coast offers a good place to see how this works.
Parts of Mexico and Central America experience a midsummer dip in rainfall known as the canícula. Its timing and strength depend on location and year.
Moisture from the Gulf of California and rising air along the Sierra Madre Occidental shape the summer storm season in northwestern Mexico.

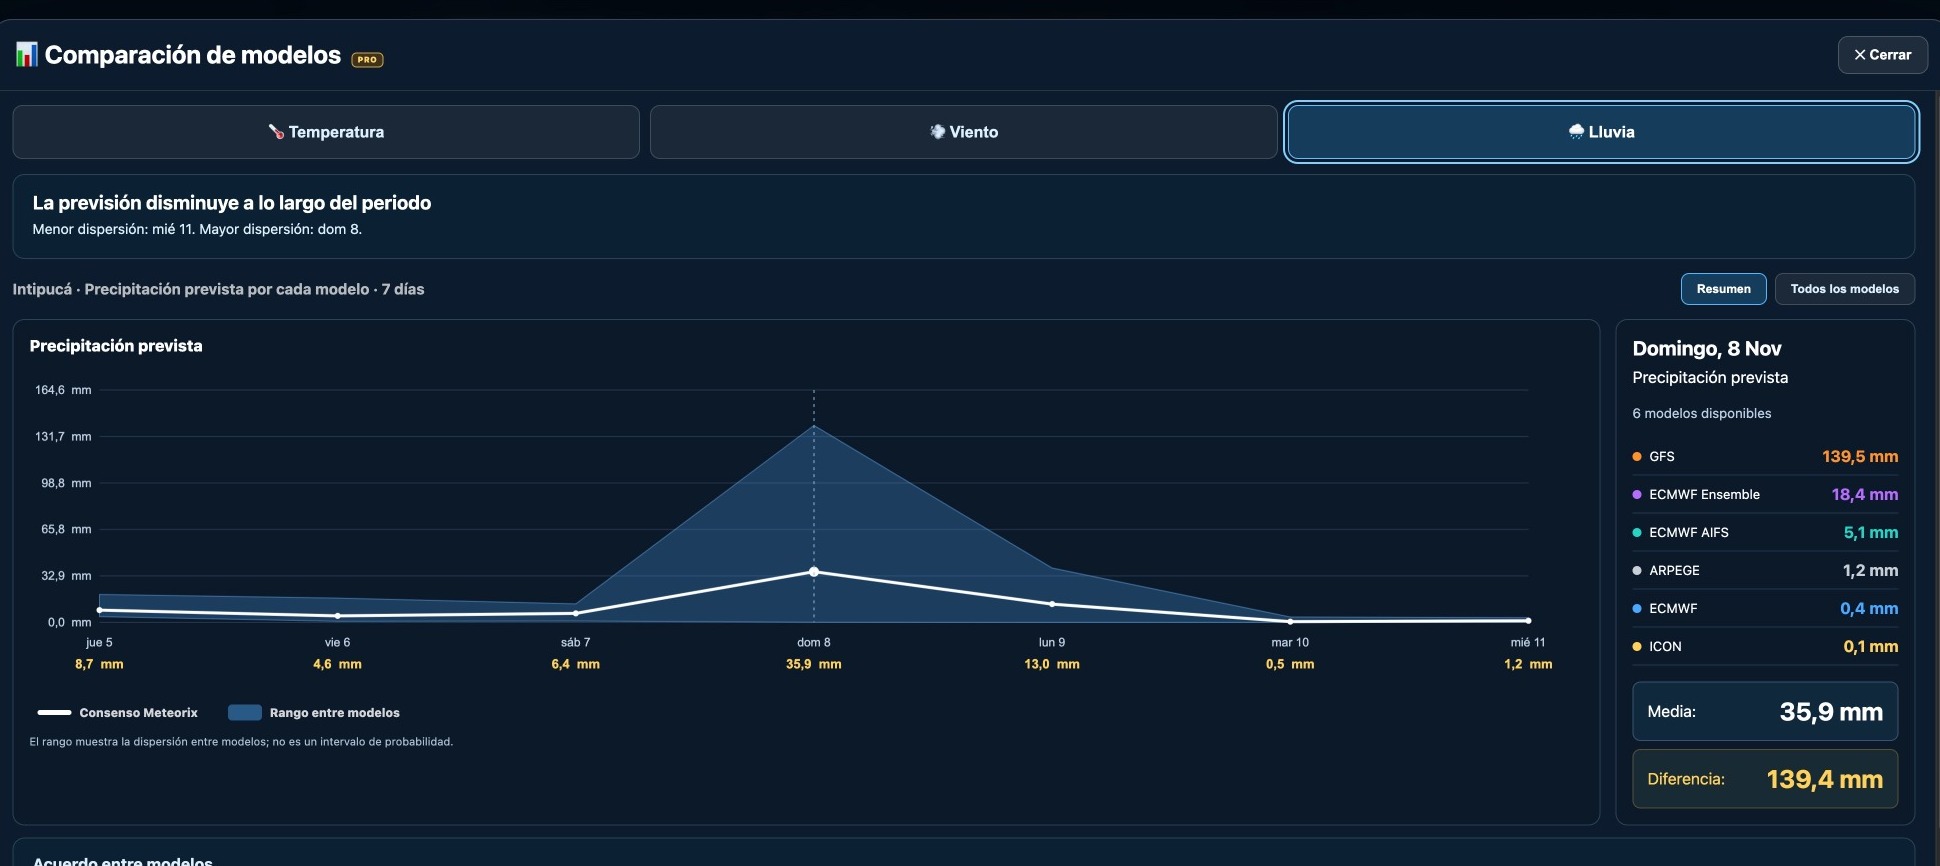
GFS forecast 139.5 mm of rain for Intipucá while several other models predicted almost none. A real Meteorix example of forecast uncertainty.
Yesterday you could see a cluster of thunderstorms on satellite imagery. Today the same cluster has a label, 92L. What changed? The code tells you how forecasters are tracking the disturbance. Its intensity is a separate question.
A wind circulation can stretch across several countries between the Caribbean and the Pacific. To see which places bear the brunt of the rain, look for the river basins that one rainband after another passes over.
When a low-pressure system deepens unusually quickly, meteorologists call it explosive cyclogenesis. Learn what they measure, why latitude matters and how to track it on a pressure map.
Cloud height and shape can help you interpret a changing sky. Learn to recognise the main cloud layers and read the Meteorix cloud cover map.
Some cut-off lows pass almost unnoticed. Others help produce extraordinary rainfall. The difference depends partly on what happens below them.